

Two curves ran upward through 2024 and 2025. One tracks how well models do on hard tests. The other tracks how often deployed systems cause documented harm. Security programs that read only the first curve are optimizing for a demo. The record that matters for risk sits in the second, and it is messier, thinner, and more revealing than the leaderboard.
This piece stays with the measured numbers. Where a source reports a count, a rate, or a score, that is what I use. Where the data is self-reported or partial, I say so, because a program built on inflated confidence about either curve fails in the same way.
The incident count is rising, and the count undercounts
The AI Incident Database recorded 233 incidents in 2024, a record high and a 56.4% increase over 2023, according to the 2025 AI Index. The following year did not slow down. The 2026 AI Index reports 362 documented incidents in 2025, up from 233 in 2024. That is a rising line across three years.
The number itself is the least interesting part. What matters for a security leader is what the count is made of and what it leaves out. The database indexes harms and near harms realized in the real world by the deployment of AI systems, per its own statement of scope. Broad inclusion means the count captures reputational and rights harms alongside safety failures, so a rise in the number does not map cleanly to a rise in any one risk category you own.
The undercount is structural, not incidental. A capstone analysis of the database noted that the total number of incidents cannot be extrapolated from it, and that a dip in intake during 2022 reflected a collection limitation rather than a true decline in incidents, as the journalism cluster study makes plain. The database depends on media reporting, and media reporting carries selective attention, language bias, and interest in what readers click. Non-English harms are systematically underrepresented, which the AIID editors acknowledge when they describe working to include more non-English reports. Read the count as a floor with a known lean, never as a measured rate.
What the incidents are made of
Monthly roundups give a better texture than the annual totals. June 2024 added 37 new incident IDs, broken into 9 disinformation and deepfake cases, 8 safety and reliability cases, 7 algorithmic bias and failure cases, 5 privacy violations, 5 fraud and scam cases, and 3 education cases, per the June 2024 roundup. That distribution is worth sitting with, because it does not match where most model-safety benchmarking energy goes.
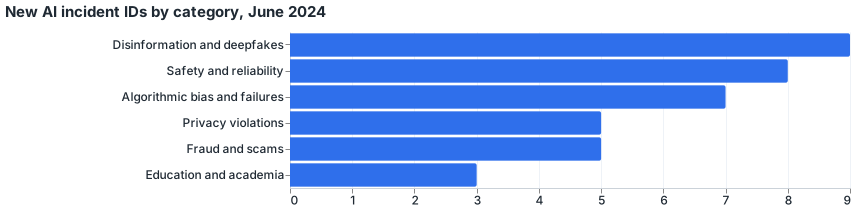
Figure 1: Six categories make up the 37 new incident IDs added in June 2024. Disinformation and deepfakes leads at 9, safety and reliability follows at 8, and education and academia is smallest at 3.
The failures that recur are mundane and operational. A transcription tool inserted fabricated content into medical transcripts, per the October and November roundup, and a faulty transcription system used by the Italian judiciary threatened the integrity of a Genoa bribery probe by mixing up illicit and licit, per the June roundup. A welfare algorithm wrongly flagged 200,000 individuals for benefit fraud, with two-thirds of the flagged claims legitimate, according to the same roundup. None of these required a frontier model or a novel jailbreak. They required a deployed system, a human who trusted its output, and no review step. For a security program, that is the operative pattern. The harm surface is integration and oversight, not model exotica.
Deepfakes and disinformation were the largest single category in June 2024's count, and their harm is the hardest to quantify. Election misinformation appeared in more than a dozen countries across over 10 platforms in 2024, yet questions remain about measurable impact, and many expected a larger effect than materialized, per the 2025 Index. Treat that cluster as high-volume and low-measurability. The cluster resists the kind of loss estimate that would let you size the risk.
The capability curve is real, and it is measured differently
Benchmark scores moved fast. On the three benchmarks built in 2023 to stress advanced systems, scores rose within a single year by 18.8 points on MMMU, 48.9 on GPQA, and 67.3 on SWE-bench, per the 2025 Index. The gap between US and Chinese models on MMLU and HumanEval shrank from double digits to near parity over the same period, per the same report. Capability is not the constraint it was.
The capability curve keeps moving because the tests keep getting harder. Epoch AI's benchmarking hub tracks results across FrontierMath, SWE-bench Verified, GPQA Diamond, and dozens of other tasks, and when a benchmark saturates the field builds a harder one, as Epoch's own FrontierMath: Open Problems set of unsolved research problems shows. That is a live measure of a moving frontier, not a fixed score.
Here is the trap. Almost all leading frontier developers report results on capability benchmarks like MMLU and SWE-bench, while reporting on responsible AI benchmarks remains sparse, per the 2026 Index. The curve that is measured well is the one that sells models. The curve that predicts deployment harm is measured poorly and reported less. A program that reads capability scores as safety assurance has confused the well-lit measurement for the relevant one.
Where safety numbers exist, they collapse under pressure
The responsible-AI benchmarks that do exist tell a consistent story: models look fine under normal conditions and fail under adversarial or unusual ones. On the AILuminate benchmark, several frontier models earned "Very Good" or "Good" safety ratings under standard use, then dropped across the board when tested against jailbreak prompts, per the 2026 Index. Standard-condition safety is not the condition your adversary will use.
Hallucination is the sharpest example. Across 26 top models, hallucination rates on a new accuracy benchmark ranged from 22% to 94%, per the 2026 Index. GPT-4o's accuracy dropped from 98.2% to 64.4% and DeepSeek R1 fell from over 90% to 14.4% when a false statement was framed as something the user believed rather than something a third party believed, per the same report. A model that is reliable in a clean test can become unreliable the moment a user's framing shifts. That is precisely the condition a deployed assistant operates in.
The tradeoffs compound the problem. Empirical studies found that training techniques aimed at improving one responsible-AI dimension consistently degraded others, per the 2026 Index. Safety, fairness, and privacy pull against each other, and the interactions are not well understood. There is no setting that maximizes all three, so any vendor claim of a solved dimension should prompt the question of what it cost elsewhere.
What this changes about program priorities
Two numbers and one absence should reorder a security roadmap.
First, transparency is moving the wrong direction. The Foundation Model Transparency Index average rose from 37 to 58 between 2023 and 2024, then fell to 40 in 2025, with persistent gaps around training data, compute, and post-deployment impact, per the 2026 Index. You are getting less disclosure from vendors at the moment you most need it, so contractual evidence requirements matter more than a vendor's published score.
Second, governance is formalizing, and that is measurable. AI-specific governance roles grew 17% in 2025, and the share of businesses with no responsible-AI policy fell from 24% to 11%, per the 2026 Index. The named obstacles are knowledge gaps at 59%, budget at 48%, and regulatory uncertainty at 41%. Those are self-reported survey figures, so treat them as direction rather than precision, but the direction is toward standards you can point to. ISO/IEC 42001 was cited by 36% of respondents and the NIST AI Risk Management Framework by 33% in their first year on the list.
Third, there is no shared definition of an AI incident. The EU AI Act ties its reporting duty to a serious incident, limited to death or serious harm to health, a serious and irreversible disruption of critical infrastructure, an infringement of fundamental-rights obligations under Union law, or serious harm to property or the environment, per Article 3. The OECD draws a wider line that counts harm to health, disruption of critical infrastructure, rights violations, and harm to property, communities, or the environment, drops the seriousness and irreversibility qualifiers, and adds a separate hazard category for events that could plausibly lead to an incident, per the AIM methodology. The AI Incident Database draws no fixed line at all and accepts reports against an adaptive rule set, per its own criteria page. Your internal incident definition will not match your regulator's, and neither will match the public database. Decide your definition deliberately, because it determines what you monitor and what you can later prove.
The honest reading
Capability is measured well and rising fast. Deployment harm is measured poorly and also rising. The safety benchmarks that bridge them are sparse, self-reported, and collapse under adversarial pressure. A program that anchors to the capability curve buys the vendor's confidence. A program that anchors to the incident curve reads a floor with a known lean and still learns more, because the failures that recur there are the ordinary ones you can control: unreviewed outputs, trusted transcriptions, unmonitored automated decisions. Fund the review step and the monitoring definition before you fund a response to the next benchmark record.